17th October 2014
In Ireland, there people still spend a vast quantity of their time going to their local grocery store. Uneven development is a major problem. But uneven development is partially caused by factors related to education and social status. So, what I’m trying to analyse in this blog is the inequalities between the primary and tertiary employment range and also the distance these groups would have to travel go shopping for food.
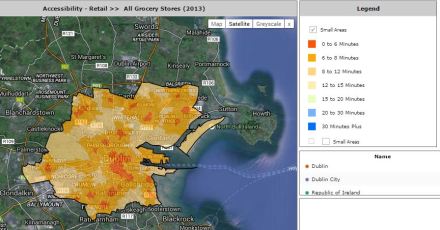
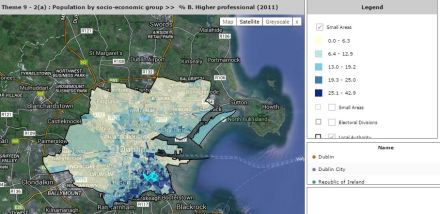
As seen in Figure 1, the people of Dublin City generally have to travel no more than ten minutes to get to a supermarket .They have the population and wealth for the convenience of all these shops – They have high levels of employment, with only 18.5% unemployed (CSO 2011). Places like Ballsbridge have a highly educated workforce (see Figure 2) which possess high wages so they spend their wages on food and live close to employment so grocery stores locate next to these people in order to maximise profits.
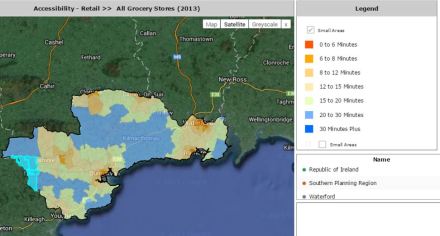
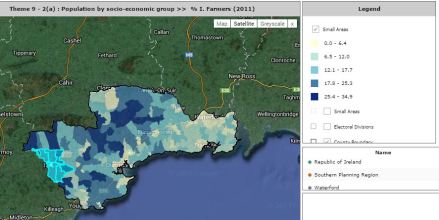
The employment industry examined will be the agricultural industry in Waterford (Figure 3) and the professional services industry in Dublin (Figure 2).
In Figure3 and Figure 4, I will focus on the towns of Tallow and Lismore in West Waterford. The residents of these places generally have to travel thirty minutes to get to a grocery market. The uneven development of these places is based on the inequality of the workforce. Working in the primary sector is poorly paid so there wealth is not shared in shops.
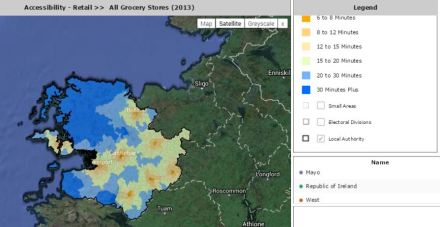
So profits are not as plentiful in rural communities when compared to urban districts like Dublin City, so grocery stores tend not to open in rural locations only. As seen in Figure 5, a similar situation exists in Mayo. The local population here also have to travel distances for food. This can show lack of wealth due to the fact no grocery stores tend not to locate in these rural areas. This in turn can affect education. 24.0 per cent were educated to third level. (CSO ,2011)
Mark O’ Brien
CSO,2011. Area profile for County Mayo , Accessed 16/10/2014 ,http://census.cso.ie/areaprofiles/areaprofile.aspx?Geog_Type=CTY&Geog_Code=02
CSO ,2011.Area pofile for County Mayo , Accessed 16/10/2014 ,http://census.cso.ie/areaprofiles/areaprofile.aspx?Geog_Type=CTY&Geog_Code=29
